Design - Organizational drill downs
Design Drilldowns for Departments, Business Units, Legal Entities, and Other Slices
Purpose
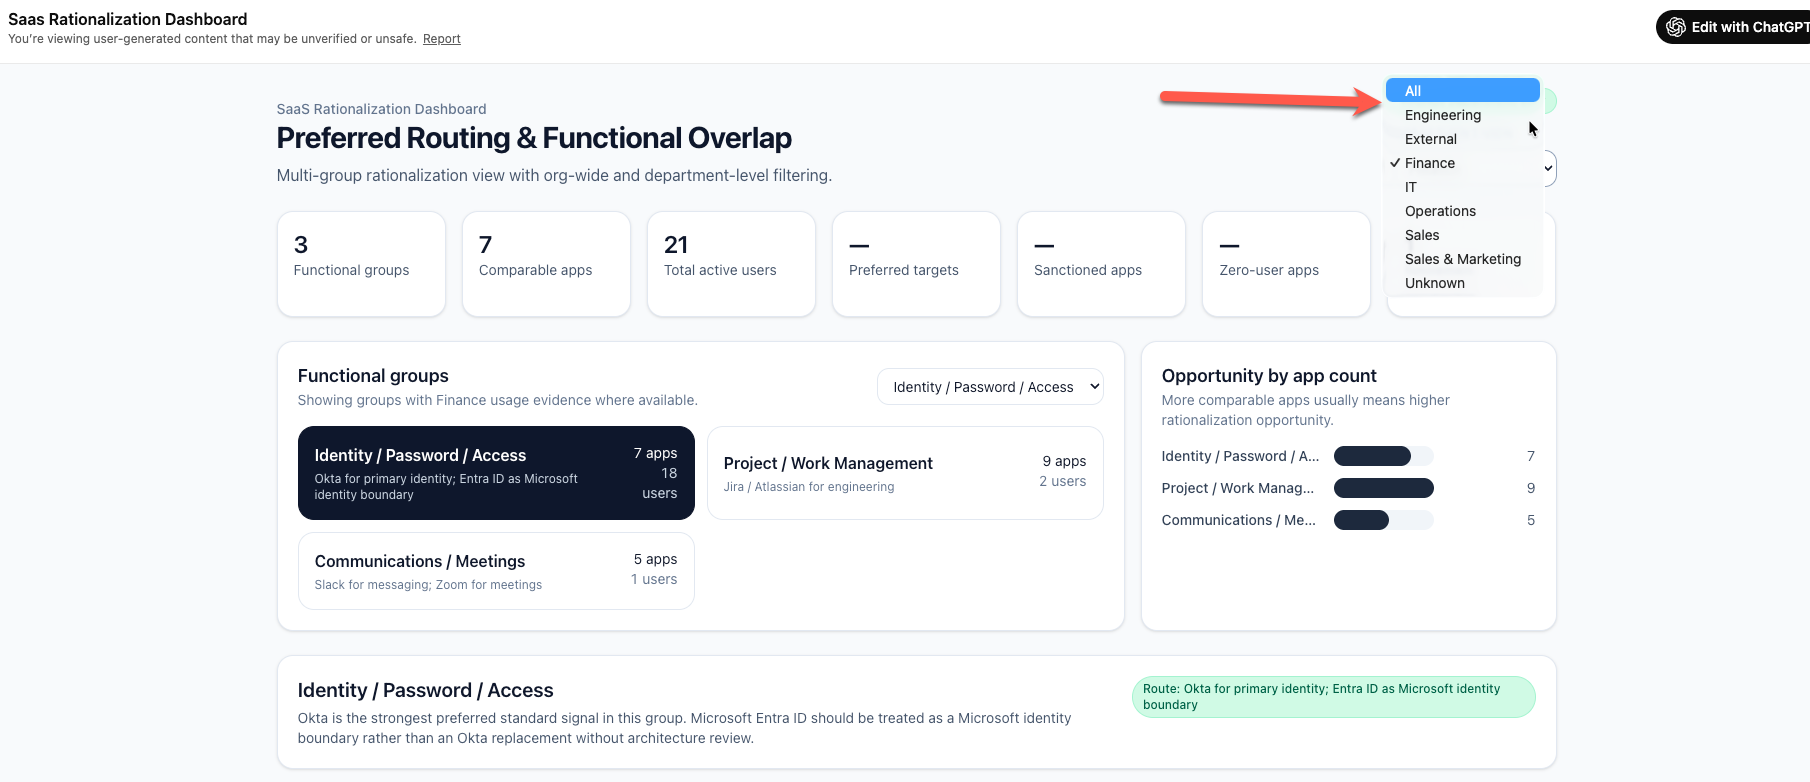
This guide provides a pattern for organizational drill downs in Torii-powered ChatGPT dashboards that integrate into your daily workflow.
The goal is not just to answer generic SaaS questions. The goal is to let you slice software usage, license consumption, spend, renewal exposure, and rationalization candidates by the business dimensions that matter in your environment.
What this guide helps you do
By the end of this guide, you should be able to:
- Choose the right primary drilldown field
- Define a reusable Organizational View mapping
- Normalize inconsistent field values
- Handle missing data and field drift safely
- Support consistent dashboard prompts and outputs across the tenant
Why this matters
A dashboard becomes much more useful when it answers questions like:
- Which Business Units have the highest concentration of overlapping apps?
- Which Legal Entities are exposed to the most upcoming renewals?
- Which Departments carry the heaviest license footprint for collaboration tools?
- Which Cost Centers are associated with the highest software spend?
Without a clean organizational drilldown model, the dashboard becomes a generic summary instead of a decision-support tool.
Start with one principle
Treat the business slice as a configurable concept called Organizational View.
Your first Organizational View might be:
- Department
- Business Unit
- Legal Entity
- Region
- Cost Center
- A tenant-specific grouping field
The important thing is not the label. The important thing is that the field is stable, useful, and reusable.
How this fits the Torii MCP model
Torii’s web MCP server lets ChatGPT query Torii data and use MCP-exposed tools while respecting the signed-in user’s Torii role and permissions.
Step 1: Choose the first Organizational View
Start with one primary business slice.
That first slice should usually have:
- Strong business meaning
- Broad coverage across the tenant
- Low null rates
- Low ambiguity
- A stable owner or steward
- Labels that business users already recognize
Good first options
Department works well when:
- Business users already organize reporting by department
- Values are reasonably normalized
- Most users have a department value
Business Unit works well when:
- Operating decisions are made at the BU level
- Leadership wants portfolio summaries by business segment
- Department values are too detailed or inconsistent
Legal Entity works well when:
- Contracts, governance, or compliance are reviewed by entity
- Software ownership is heavily entity-specific
- Corporate structure matters more than operational teams
Region works well when:
- Software decisions are geographically distributed
- Support, usage, or compliance varies by geography
- Business leaders think in regional rollups
Cost Center works well when:
- Finance is a major stakeholder
- Chargeback or spend ownership matters
- Renewal and budget reviews happen through finance structures
Step 2: Validate whether the field is fit for dashboard use
Before you approve a field, inspect it for data quality.
Look for:
- Missing values
- Duplicate meanings under different labels
- Old and new labels mixed together
- IDs mixed with readable names
- Values that are too technical for business users
- Values that are too granular to be useful in summaries
Good example
A field with values like:
- Sales
- Marketing
- Finance
- Engineering
- Operations
Weak example
A field with values like:
- ENG
- Engineering
- Engineering Team
- 001-ENG
- Null
The second example may still be usable, but only after normalization.
Step 3: Define the Organizational View mapping
Once you pick the first slice, document it explicitly.
Use a simple mapping record with the following elements:
- source field name
- dashboard label
- description
- normalization rules
- null handling rule
- fallback behavior
- owner
- last reviewed date
Recommended mapping template
Use a structure like this:
{
  "organizationalView": {
    "sourceField": "department",
    "displayLabel": "Department",
    "description": "Primary dashboard drilldown for portfolio, usage, licenses, and spend",
    "normalization": {
      "ENG": "Engineering",
      "Engineering Team": "Engineering",
      "MKTG": "Marketing"
    },
    "nullHandling": "Exclude from grouped sections and report separately as Unmapped",
    "fallbackBehavior": "Pause affected dashboard sections if unmapped share exceeds threshold",
    "owner": "IT Operations",
    "lastReviewed": "2026-05-05"
  }
}
This does not have to be complex. The point is to make the Organizational View intentional and repeatable.
Step 4: Normalize values before you rely on them
Even a good source field often needs cleanup.
Common normalization tasks include:
- Expanding abbreviations
- Merging legacy labels into current names
- Correcting capitalization
- Removing technical prefixes
- Collapsing synonyms into one approved value
Example normalization
Before:
- ENG
- Engineering
- Engineering Team
After:
- Engineering
Another example
Before:
- NA
- North America
- N. America
After:
- North America
Normalization helps in two places:
- the visual consistency of the dashboard
- the accuracy of grouped counts, spend totals, and review queues
Step 5: Decide how to handle unmapped or missing values
Do this early.
If you do not define unmapped behaviour, the dashboard can quietly produce misleading rollups.
Recommended options:
- Group missing values under Unmapped
- Exclude unmapped values from grouped sections and report the excluded count
- Pause a section if the unmapped share is too high
Recommended default
For most dashboard sections:
- Include a visible Unmapped bucket when missing data is low
- Pause or warn when missing data is high enough to distort interpretation
Example warning language
The Business Unit drilldown excludes 14% of records because the mapped field is missing or not normalized. Treat grouped results as directional until the mapping is updated.
Step 6: Set a threshold for acceptable quality
Define simple rollout rules.
For example:
- If missing values are under 5%, continue and show an Unmapped bucket
- If missing values are 5% to 15%, continue with a warning
- If missing values exceed 15%, pause affected grouped sections
These exact thresholds are implementation choices, not Torii product rules. Pick values that match your governance standards.
Step 7: Reuse one approved label in prompts and outputs
Once you choose the Organizational View, use the same business-facing label everywhere.
If the source field is department_name, but the business label is Department, then always present it as Department in:
- Prompt packs
- Dashboard headings
- Summaries
- Explanations
- Review queues
That keeps the experience clean for non-technical users.
Step 8: Build dashboard sections around the approved Organizational View
Each grouped section should clearly state the slice being used.
Examples
- Usage by Department
- Spend by Business Unit
- Renewal Exposure by Legal Entity
- License Distribution by Cost Center
- Overlap Candidates by Region
This helps users trust what they are looking at and prevents silent switching between dimensions.
Step 9: Support one primary slice first, then add alternates
Do not try to support every possible business slice on day one.
Roll out in this order:
- Approve one primary Organizational View
- Validate dashboard usefulness with that slice
- Add one or two alternates later if there is strong demand
- Document each alternate mapping separately
This reduces confusion and limits early maintenance overhead.
Recommended alternate-slice strategy
After the primary slice is stable, you can add alternates like:
- Primary: Business Unit
- Alternate 1: Legal Entity
- Alternate 2: Cost Center
Each alternate should have its own:
- Mapping definition
- Normalization rules
- Null handling rules
- Last reviewed date
Step 10: Watch for field drift
Field drift is one of the highest-risk operational issues in a dashboard like this.
Common field drift patterns include:
- A field gets renamed
- A field changes type
- Labels change without notice
- A field becomes less complete
- A field starts mixing old and new business vocabularies
Recommended response
If drift affects a grouped dashboard section:
- Pause the affected section
- Say what changed
- Ask for a replacement or updated mapping
- Avoid silently guessing
Good example
The Legal Entity drilldown was not generated because the previously approved source field no longer appears with the expected structure. Update the mapping before using this section.
Step 11: Use a lightweight mapping review cadence
Treat the Organizational View as a governed configuration, not a one-time choice.
Recommended review triggers:
- Monthly review for new rollouts
- Quarterly review for stable deployments
- Immediate review after unexpected output changes
- Immediate review after major HRIS, IdP, or data-model changes
Suggested ownership model
The cleanest ownership pattern is usually:
- Business owner approves the label and grouping intent
- Technical owner maintains the mapping and normalization rules
- Dashboard users flag drift or confusing groupings
Prompt patterns that rely on Organizational View
Once your mapping is approved, prompt patterns should consistently use the chosen label.
Department prompts
Show software usage by Department.Which Departments have the most overlap across collaboration apps?
Business Unit prompts
Summarize software spend by Business Unit.Which Business Units have the highest concentration of design tools?
Legal Entity prompts
Show renewal exposure by Legal Entity for the next 90 days.Which Legal Entities have the largest footprint of security tools?
Cost Center prompts
Show license distribution by Cost Center.Which Cost Centers have the highest SaaS spend concentration?
Output rules for grouped sections
Every grouped section should include:
- The exact Organizational View used
- Whether normalization was applied
- Whether unmapped values were included or excluded
- A confidence note if data quality is imperfect
Example output note
Grouped by Business Unit. Normalization applied to 6 legacy labels. 3% of records are unmapped and shown separately.
What not to do
Avoid these mistakes:
- Treating Department as universal
- Using a field before checking its coverage
- Silently merging inconsistent labels
- Hiding unmapped values
- Letting different sections use different business slices without explanation
- Guessing a replacement field after drift
Final checklist
Before you call your Organizational View ready, confirm that:
- One primary business slice is approved
- The source field is documented
- Normalization rules are defined
- Missing-value behavior is defined
- A fallback rule exists for poor-quality data
- Dashboard prompts use the approved business-facing label
- Grouped outputs disclose unmapped or normalized values
- A review owner is assigned
What comes next
Once the Organizational View is stable, the next step is to package the experience for delivery.
That means deciding whether to deploy the dashboard as:
- Plain ChatGPT plus Torii MCP
- A Custom GPT wrapper
- An Agent wrapper for scheduled refreshes
Updated 3 months ago